Why It Exists
Default Playwright reporters show pass/fail counts. That's it. When a test fails in CI, you get a stack trace and maybe a screenshot — then you spend the next 30 minutes reconstructing what the test was actually doing and why it might have broken.
Meanwhile, BDD documentation (if it exists at all) lives in a separate tool, disconnected from actual test execution. The gap between "what we say we test" and "what actually ran" widens every sprint.
playwright-spec-doc-reporter closes that gap. One reporter. One self-contained HTML file. Everything in one place.
Features
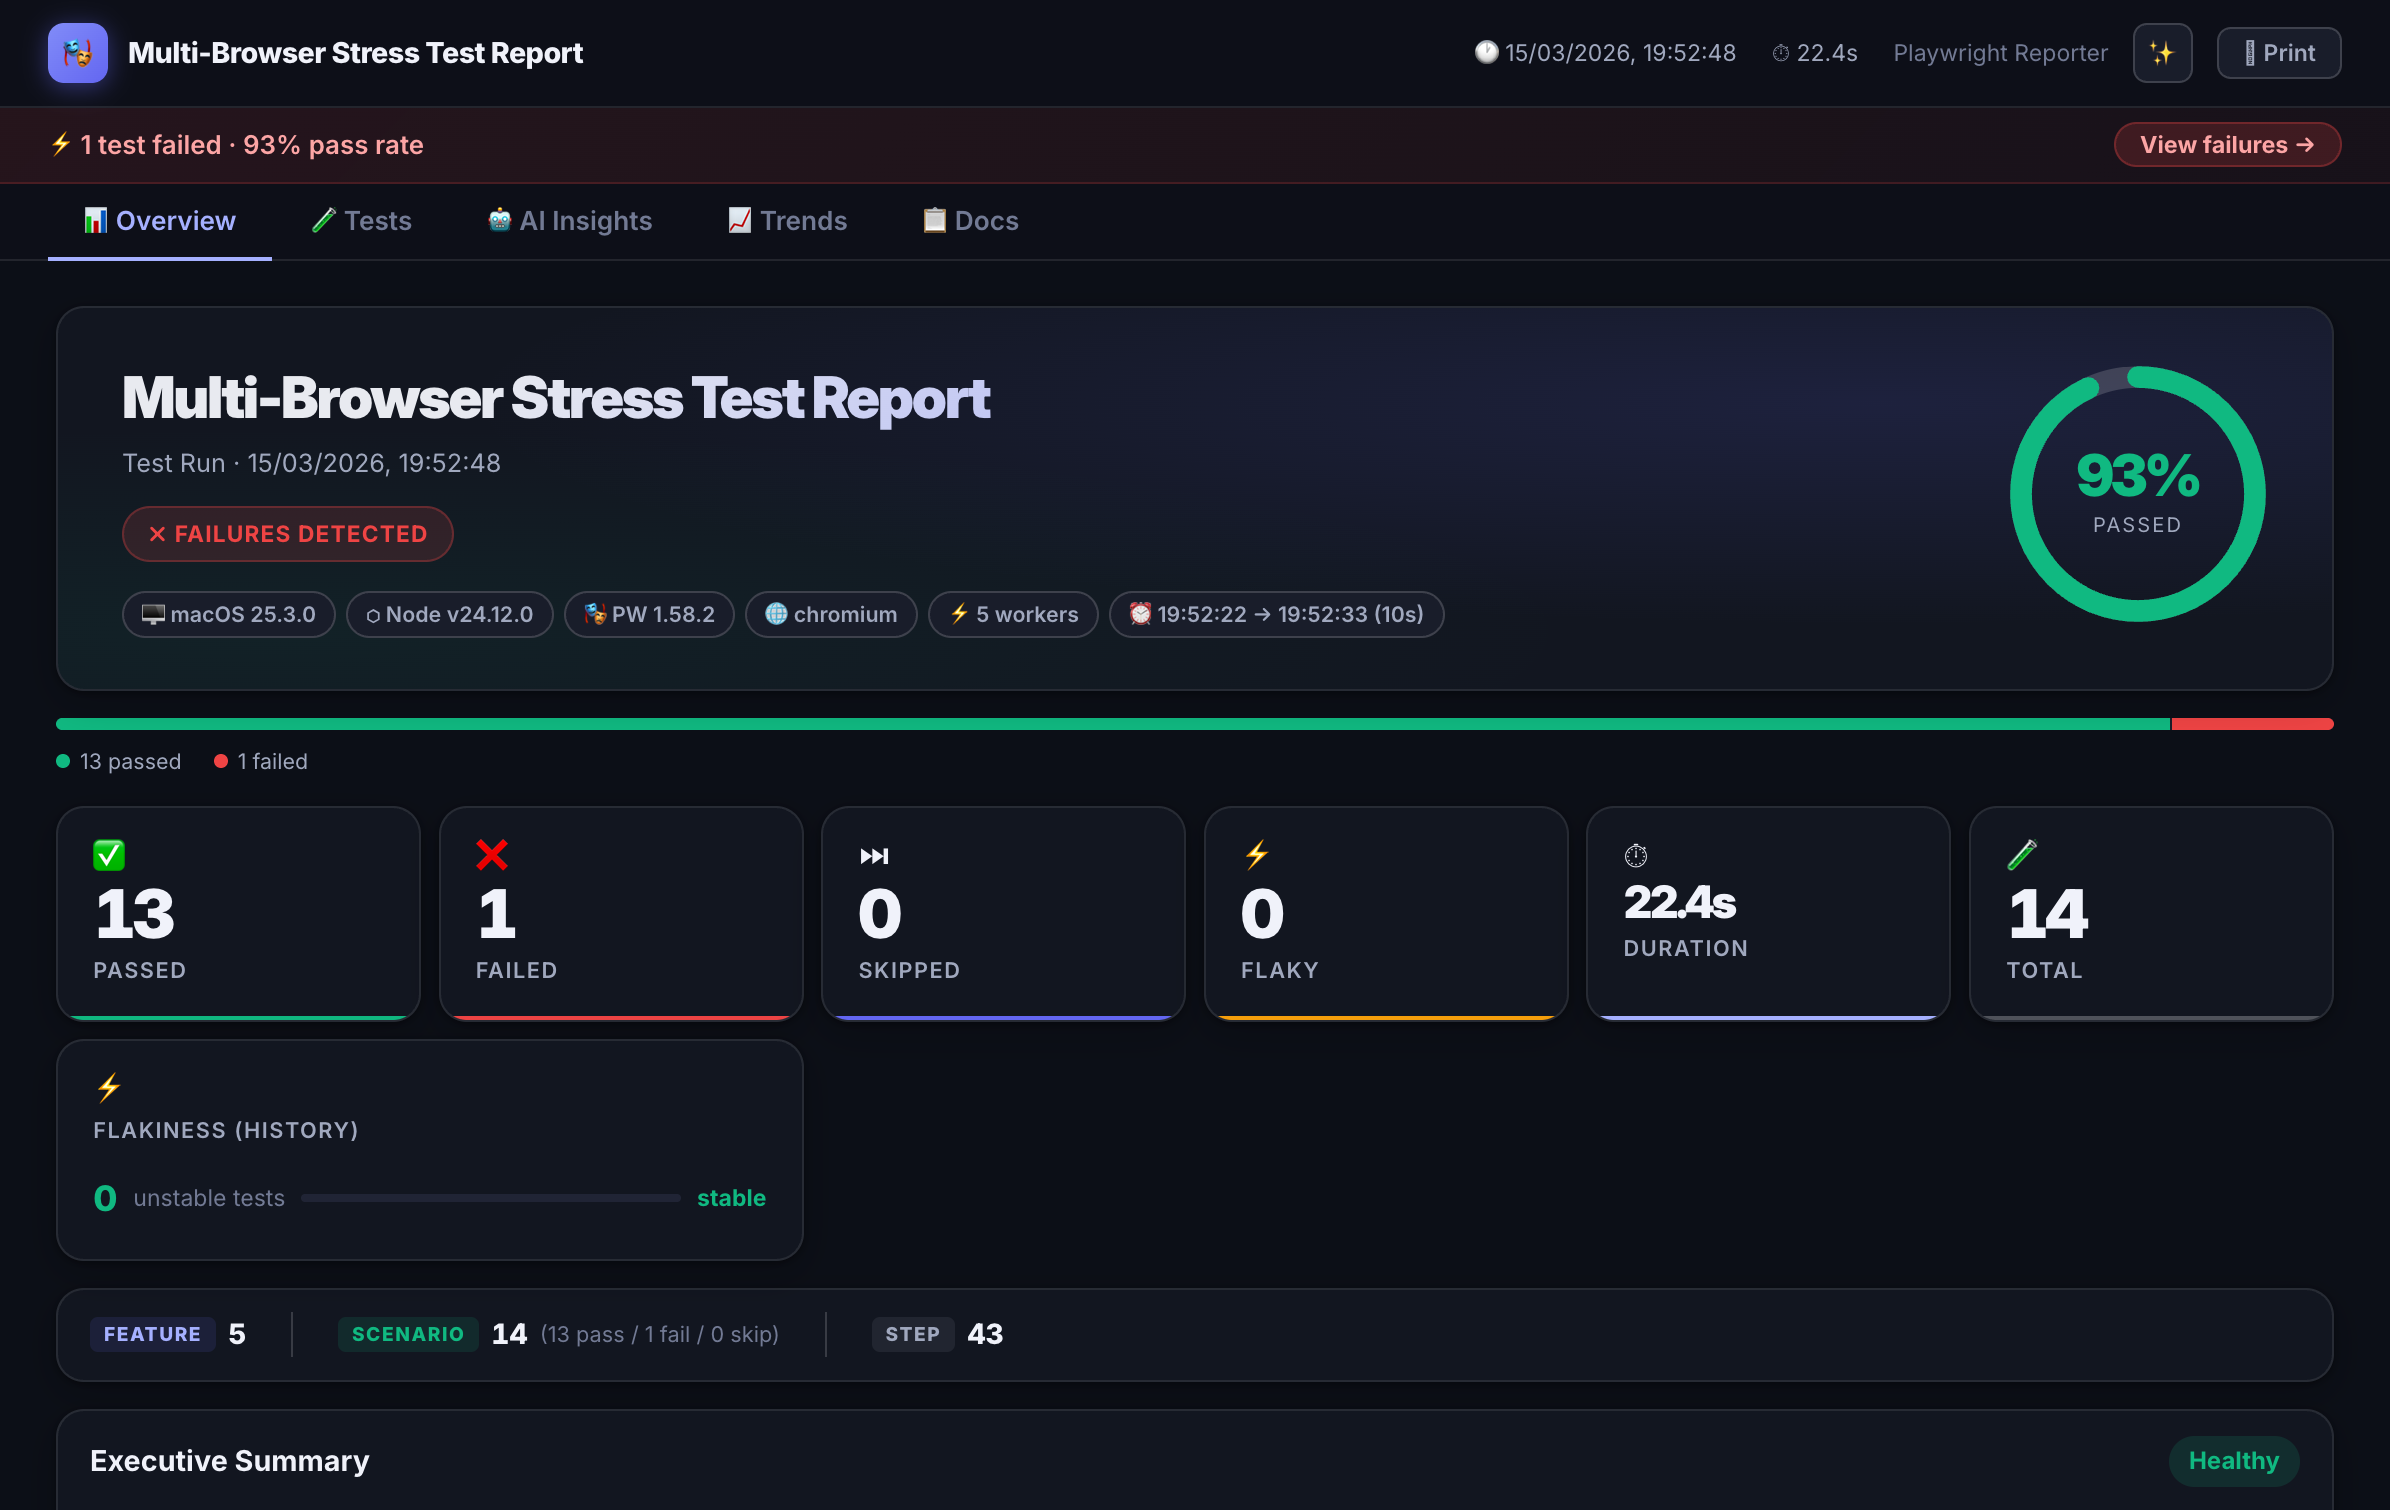
Interactive HTML Dashboard
Dark-themed, self-contained report with filter, search, sort, and failure drill-down. No server needed — open the file anywhere.
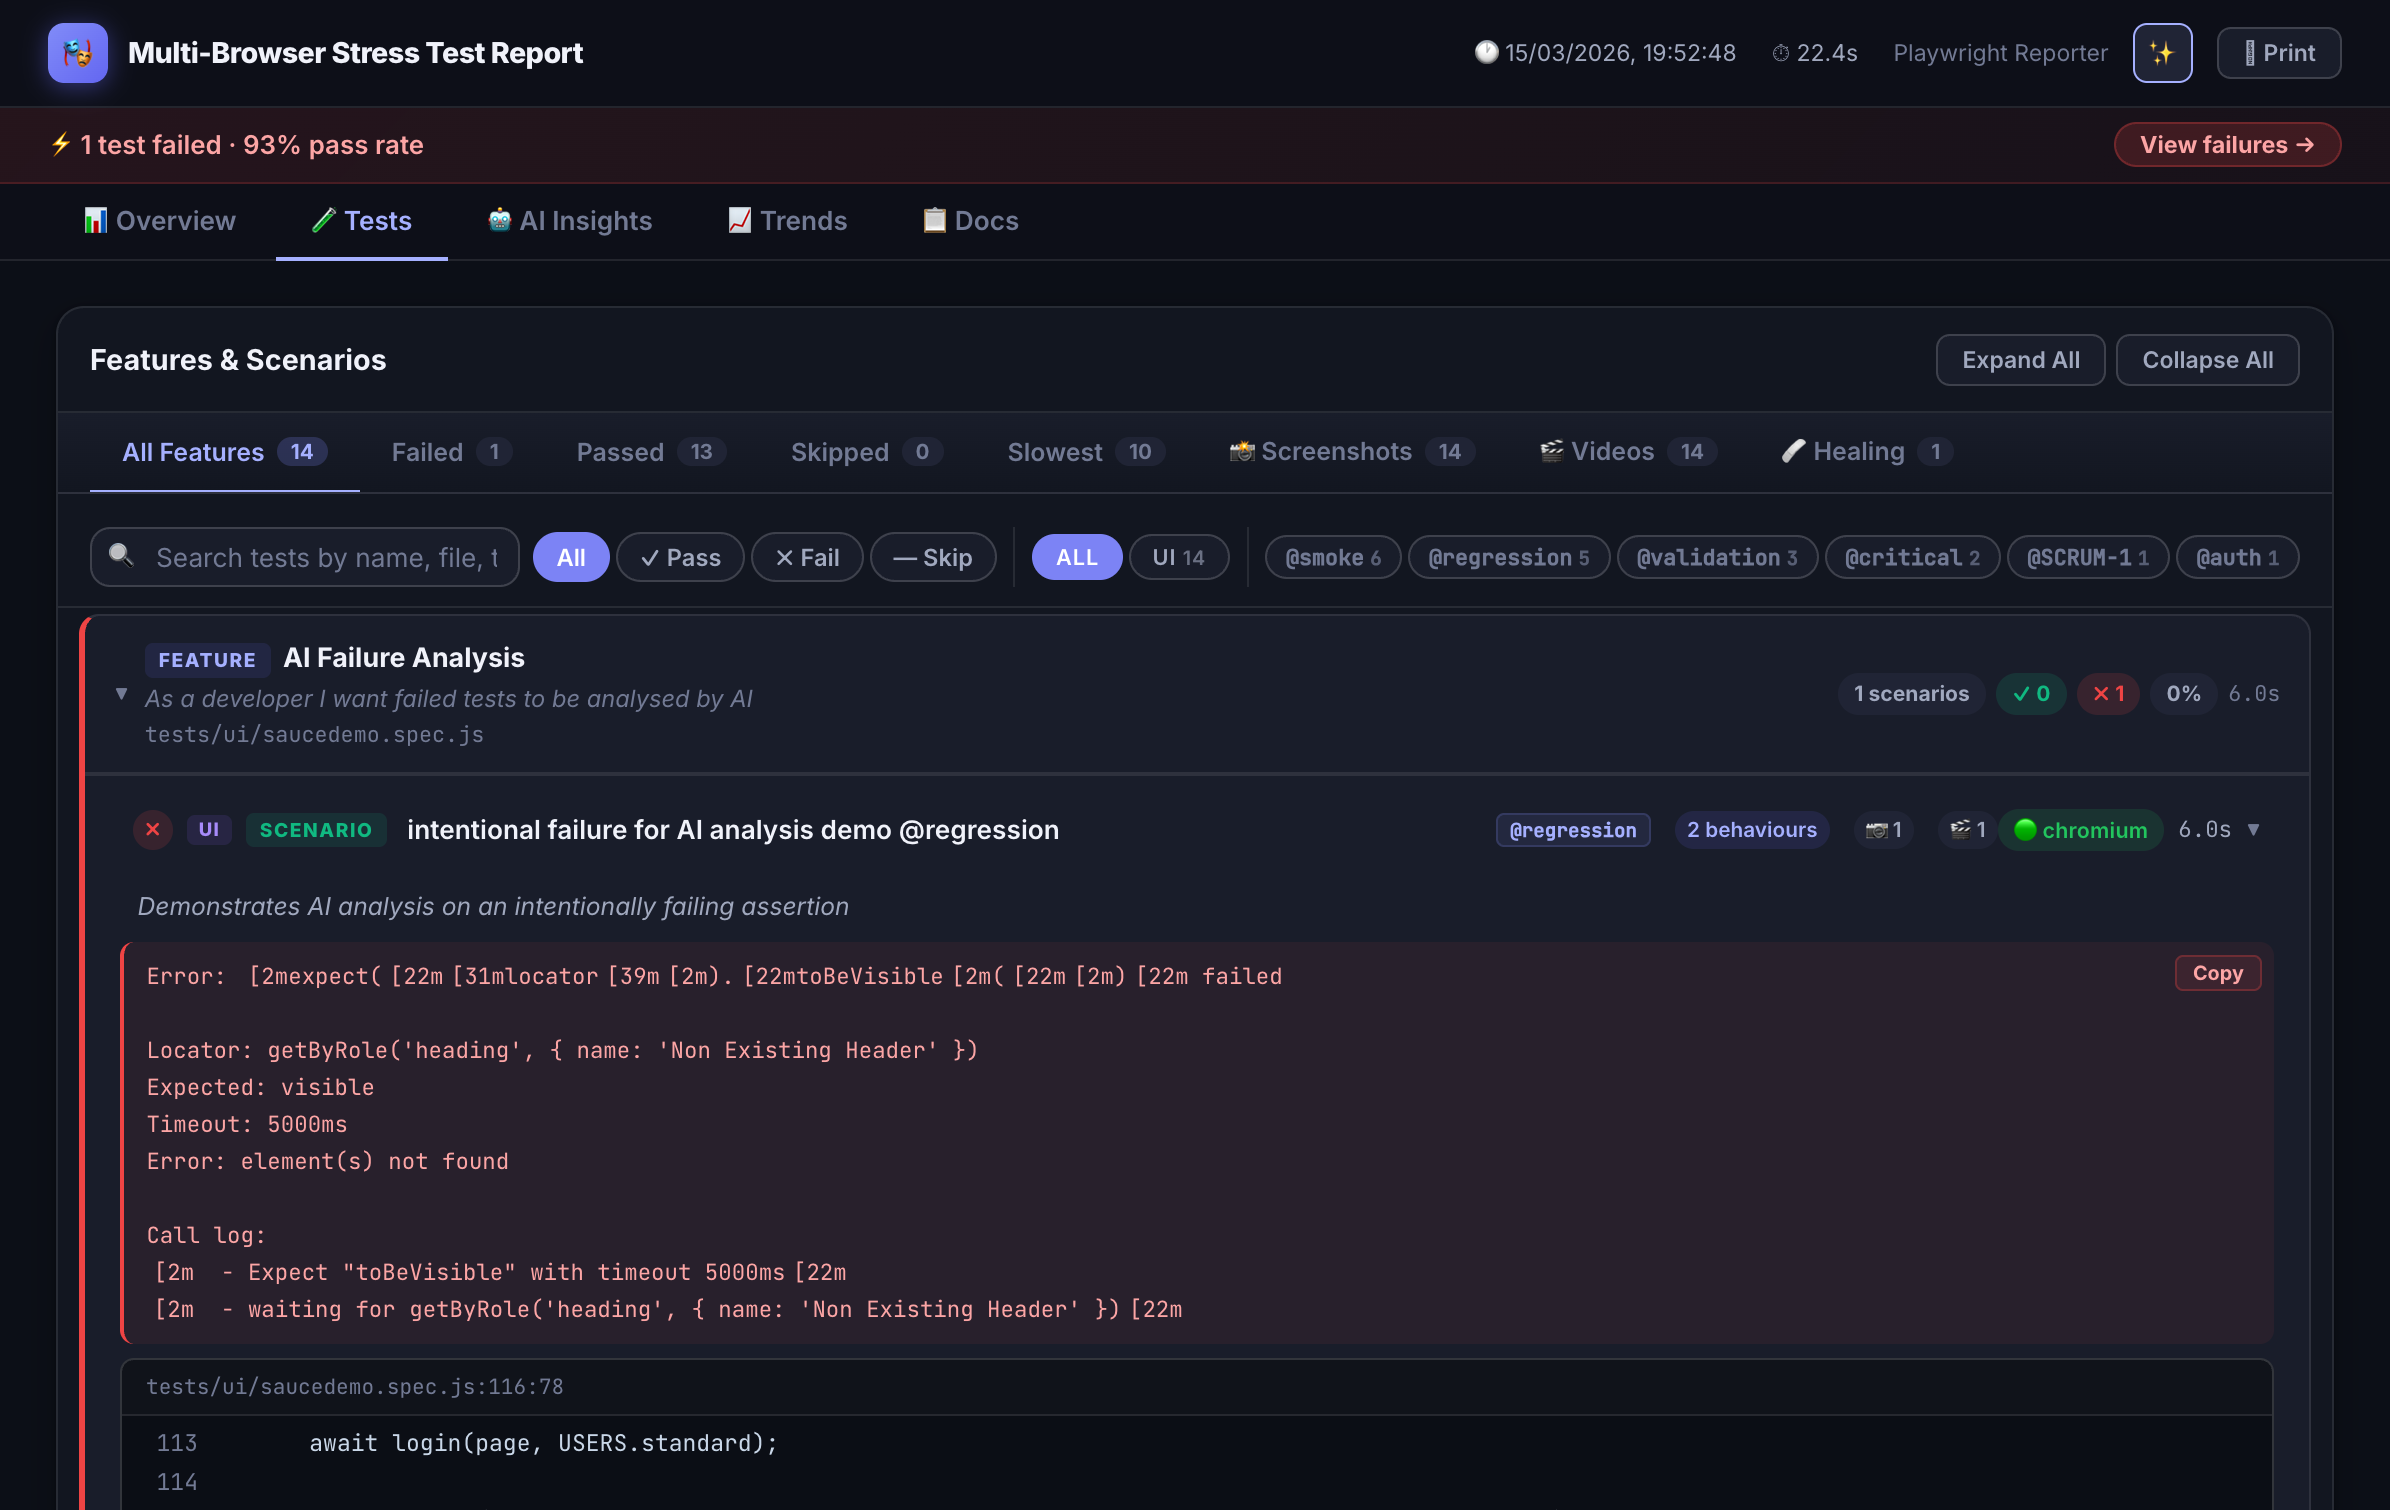
BDD Annotations
Attach Feature, Scenario, and Behaviour metadata directly in test code. The reporter extracts and renders them as living documentation.
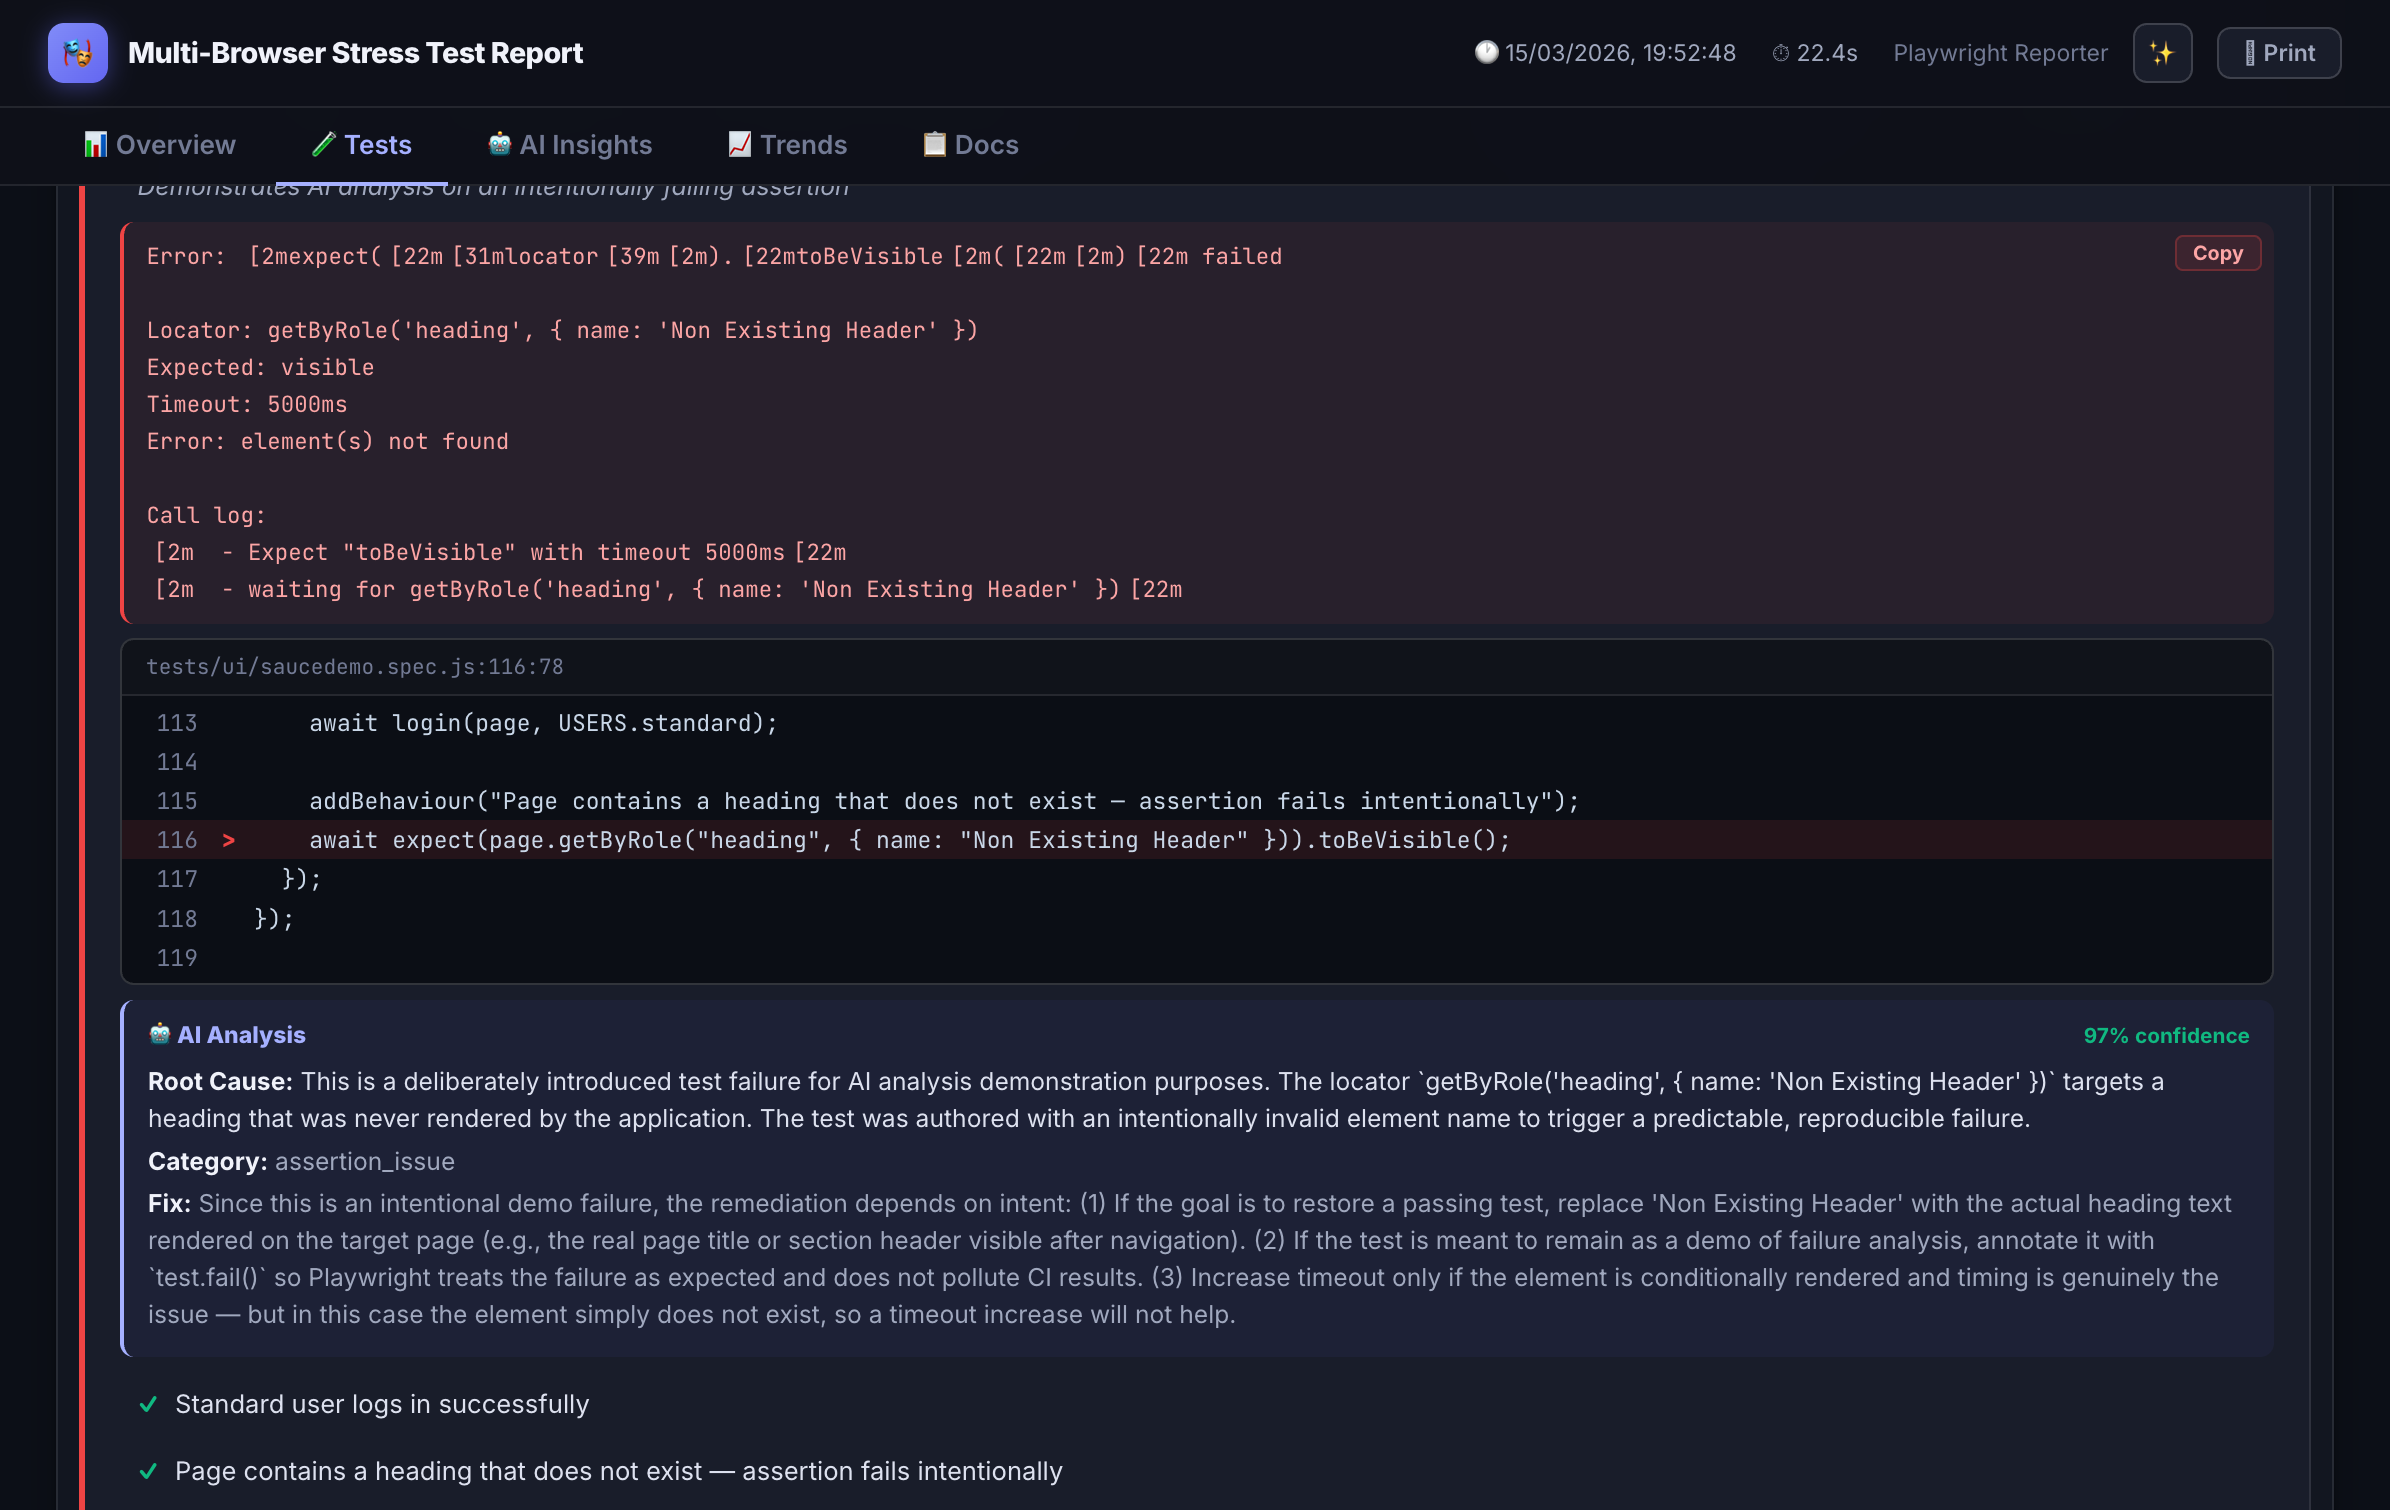
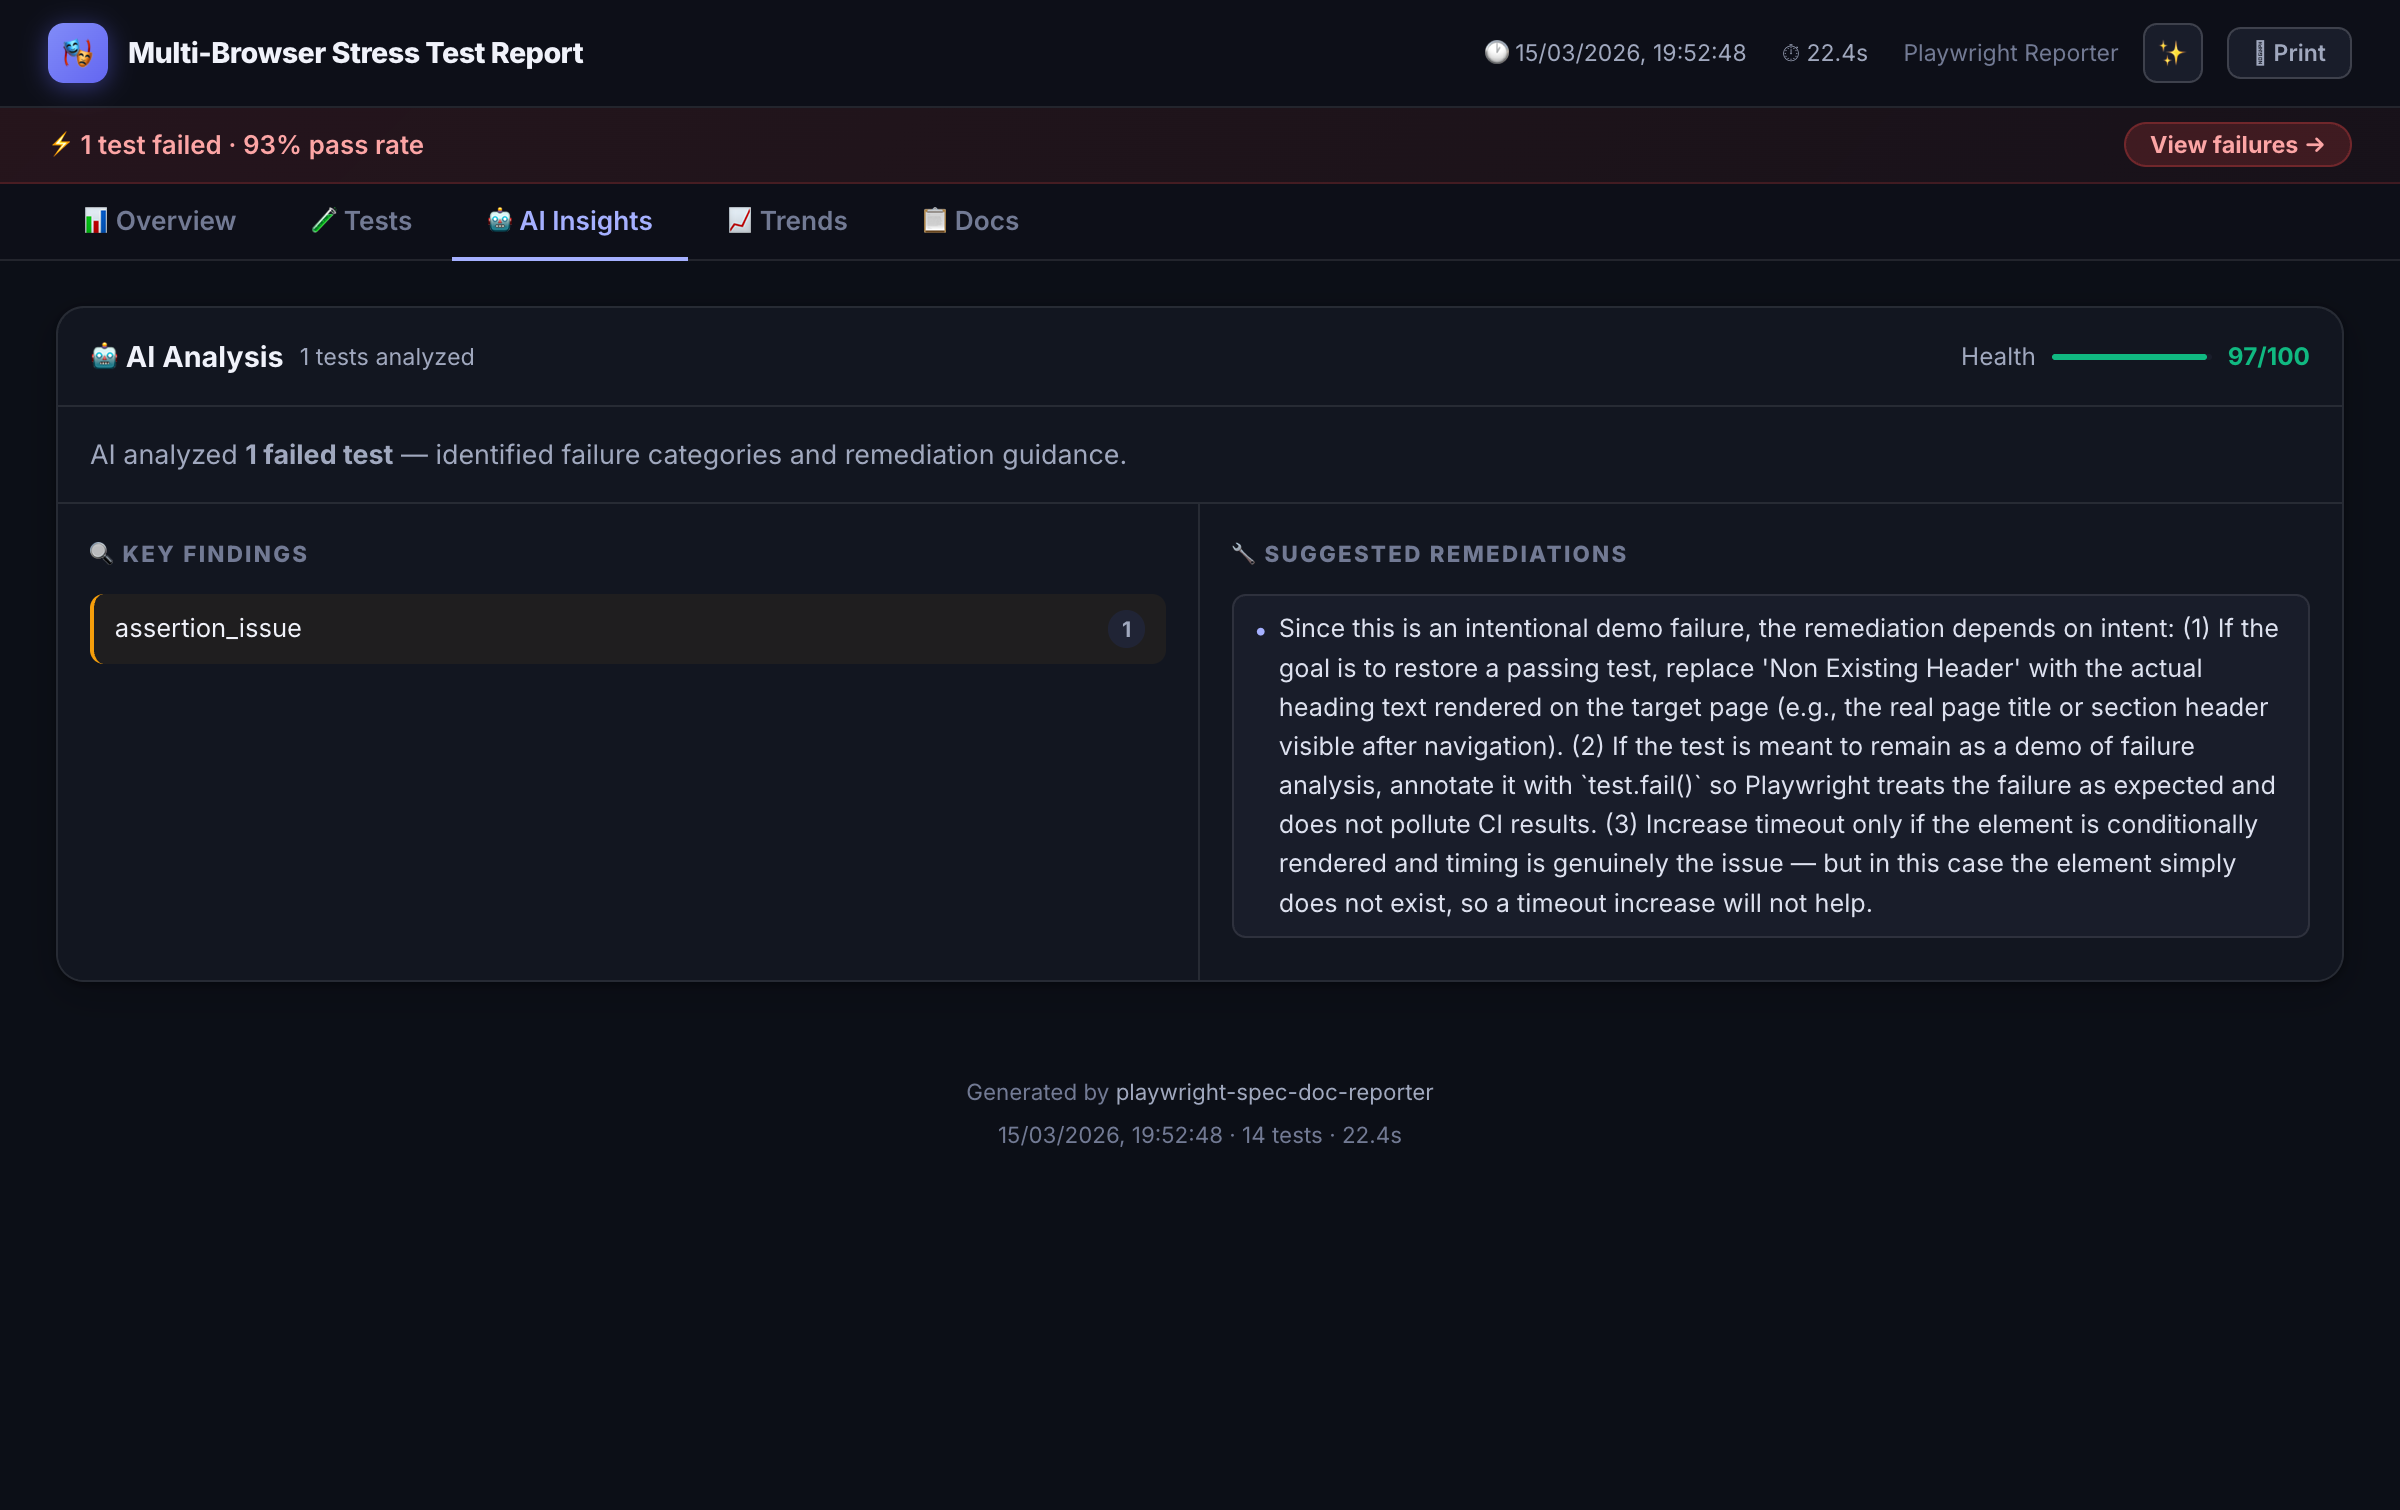
AI Failure Analysis
When tests fail, sends context to Claude, GPT-4, Azure OpenAI, or a custom provider for structured root-cause explanations.
Self-Healing Layer
Detects auto-healed locator drift from Playwright Healer, shows diff panels, and generates healing payloads for triage.
Jira Integration
Automatically posts test results as comments on tagged Jira issues — with screenshots, API logs, and pass/fail status.
PR Comment Mode
Emits a compact markdown summary for posting directly as a GitHub or Azure DevOps pull request comment.
Flakiness Scoring
Per-test stability badges (0–100%) computed from run history. Surfaces unreliable tests before they become incidents.
History & Trends
Pass-rate and duration charts across runs stored in spec-doc-history.json. Track regression patterns over time.
Inline API Viewer
Attach request/response JSON directly to test results with syntax highlighting — no more digging through network logs.
Spec-to-Test Traceability
Maps Playwright Agent spec files to generated tests via code comments. Closes the loop between spec and execution.
Manual Test Results
Merge manually-authored Gherkin or prose results into the same report. Unified view across automated and manual coverage.
Zero Runtime Dependencies
Output is a single self-contained HTML file. No external CDN calls, no server, no setup — just open it.
Installation
npm install -D playwright-spec-doc-reporter
Because Playwright reporters are loaded in a separate worker context, create a thin
reporter.mjs shim in your project root:
// reporter.mjs
export { default } from 'playwright-spec-doc-reporter/reporter';
Then reference it in playwright.config.ts:
import { defineConfig } from '@playwright/test';

export default defineConfig({
  reporter: [
    ['./reporter.mjs', {
      outputFolder: './test-results',
      theme: 'dark-glossy',       // 'dark-glossy' | 'dark' | 'light'
      aiAnalysis: true,
      aiProvider: 'anthropic',    // 'anthropic' | 'openai' | 'azure' | custom
      jiraIntegration: false,
      prComment: false
    }]
  ]
});
BDD Annotations
Add structured metadata to any test using annotation helpers from the package. The reporter extracts these at runtime and renders them as navigable BDD documentation alongside execution results.
import { test } from '@playwright/test';
import { feature, scenario, behaviour } from 'playwright-spec-doc-reporter/annotations';

test('user can complete checkout', async ({ page }) => {
  feature('Checkout Flow');
  scenario('Complete purchase with credit card');
  behaviour('Given the user has items in their cart');
  behaviour('When they proceed to checkout and submit payment');
  behaviour('Then an order confirmation is displayed');

  await page.goto('/cart');
  // ... test steps
});
AI Failure Analysis
When a test fails, instead of just seeing TimeoutError: locator.click() timed out,
the dashboard surfaces a structured explanation:
"The checkout button wasn't clickable because a promotional modal appeared and blocked the element. This is likely a race condition — the modal loads asynchronously after page navigation but before the click action executes. Consider waiting for the modal to dismiss or handling it in test setup."
Analysis runs against Claude (Anthropic), GPT-4 (OpenAI), Azure OpenAI, or any custom provider endpoint you configure. Context sent to the model includes the error message, test code, BDD annotations, and any attached screenshots.
Output Files
| File | Purpose |
|---|---|
| index.html | Main report — self-contained, open anywhere |
| results.json | Machine-readable results for CI/CD processing |
| spec-doc-history.json | Run history used for trend charts and flakiness scores |
| healing.json | Locator drift payloads from the self-healing layer |
| traceability.json | Spec-to-test mapping for coverage traceability |
| pr-comment.md | Markdown summary for GitHub/Azure DevOps PR comments |
Roadmap
- Tag Analytics: Coverage breakdown by feature area, priority, or custom tags
- Slack/Teams Webhooks: Push failure summaries directly to team channels
- Test Ownership: Assign tests to teams or individuals via API
- DORA Metrics: Tie test results to deployment frequency and change failure rate
- Xray Integration: Sync results back to Jira Xray test plans